India’s New IIP Base Year 2022-23: Why the Industrial Production Index Has Been Rebuilt
The revised index aims to capture today’s manufacturing structure more accurately, but users must understand what changed before comparing new and old growth numbers.
Commentary & Analysis ·

India’s statistical system is undergoing one of its most important measurement updates in years. The Ministry of Statistics and Programme Implementation has revised the base year of the Index of Industrial Production from 2011-12 to 2022-23, with an updated product basket, industry coverage and weights. The new series is designed to represent the present structure of Indian industry rather than an economy frozen in the production patterns of more than a decade ago. For investors, businesses and policymakers, the change affects how monthly industrial growth is interpreted.
The India IIP base year 2022-23 is not merely a cosmetic reset in which the index is set to 100 in a more recent year. A base-year revision usually involves reselecting products, updating the importance assigned to different industries, reviewing data sources and aligning classifications with current economic activity. Industries that expanded rapidly after 2011-12 may receive greater representation, while obsolete or less significant products can be removed or assigned lower weight. The objective is to reduce the gap between the index and the real industrial economy.
The new Index of Industrial Production remains a high-frequency indicator. It tracks changes in the volume of output in mining, manufacturing and electricity. Governments use it to assess momentum, economists use it in forecasts, and companies use it to compare sector performance. Because it is released more frequently than comprehensive national accounts, the IIP can influence market expectations. Yet it is an index, not a complete measure of industrial profitability, employment or value added. A factory can produce more units while earning less profit, and automation can raise output without a corresponding rise in jobs.
The MoSPI statistics revision responds to structural changes that accelerated over the past decade. India has expanded in electronics assembly, renewable-energy equipment, pharmaceuticals, technical textiles, speciality chemicals and new categories of machinery. Supply chains have become more integrated with digital inventory and formal tax data. A basket centred on older products can understate growth in emerging industries and overstate sectors that have lost relative importance. Updating weights helps the index reflect where production actually occurs today.
The choice of 2022-23 as the base year has practical advantages and limitations. It is recent enough to capture post-pandemic industrial patterns and newer data systems. However, the period may also contain unusual effects from supply-chain recovery, policy support and shifts in global demand. Statistical committees therefore need to test whether the year is sufficiently normal and whether annual weights are robust. MoSPI’s technical advisory process is intended to address those questions through industry consultation and methodological review.
Users should be careful when comparing growth rates across the changeover. A new basket and new weights can produce a different picture even when the underlying factories are the same. MoSPI may provide a back series or linking factors, but perfect comparability is rarely possible. Analysts should identify which series they are using, avoid joining two datasets without adjustment and explain any break in charts. A dramatic improvement or slowdown near the transition may reflect methodology rather than a sudden real-world event.
The IIP product basket also affects sector stories. Suppose electronics receives a higher weight and grows quickly while a traditional heavy industry contracts. The new index may show stronger manufacturing growth than the old series would have shown. That is not manipulation if the new weight better reflects economic importance. Conversely, an updated basket can reveal weakness that was previously hidden. Transparent publication of weights, item lists, response rates and revision policies allows independent researchers to test the result.
Data quality depends on reporting by factories and administrative systems. Missing or delayed returns can force statisticians to estimate output, and provisional numbers may later be revised. The shift towards digital collection can improve speed and reduce transcription errors, but it creates new risks involving system outages, classification errors and inconsistent identifiers. MoSPI should publish metadata that explains imputation, coverage and revision size. Users need to know not only the headline growth rate but also how much of the index is based on actual reported data.
The updated industrial production index is part of a broader overhaul that includes newer base years for gross domestic product and consumer prices. These changes should make India industrial growth data more relevant and internationally comparable. They also create an opportunity to improve public communication. Statistical releases can be technically correct yet easily misunderstood. Clear visualisations, downloadable machine-readable files and plain-language explanations should accompany the detailed methodology.
For policymakers, a more accurate IIP can improve decisions on infrastructure, credit, trade and industrial incentives. If data shows a persistent bottleneck in a particular sector, authorities can investigate logistics, power supply or import dependence. But monthly volatility should not trigger hasty intervention. Festival timing, weather, maintenance shutdowns and base effects can move the index sharply. A three- or six-month trend, supported by employment, tax and trade data, is more informative than one month in isolation.
Businesses should also resist using the new series as a substitute for their own market intelligence. National output can rise while a company’s product category contracts. Regional patterns may differ sharply. The IIP is most useful as a benchmark that can be combined with order books, capacity utilisation, purchasing managers’ surveys and company results. Understanding the methodology helps managers distinguish a broad industrial cycle from a sector-specific problem.
The India IIP base year 2022-23 revision is ultimately an investment in economic visibility. Better measurement does not create industrial growth, but it allows the country to see growth and weakness more accurately. The credibility of the new index will depend on transparent methods, consistent revisions and open access to data. When those conditions are met, a rebuilt IIP can give policymakers and businesses a clearer instrument panel for a rapidly changing economy.
You may also like to read
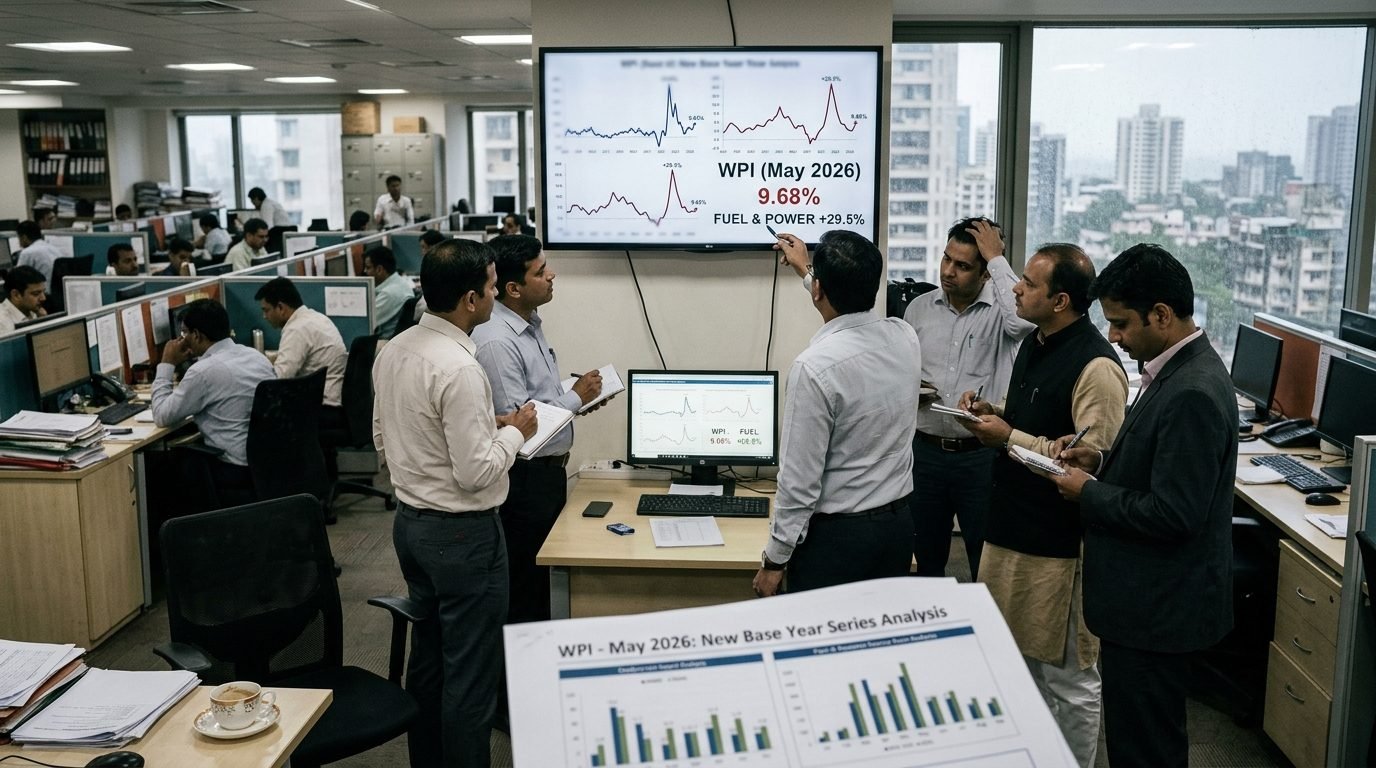
India's Wholesale Inflation Jumps To 9.68% In May As New 2022-23 Base Year Debuts
Wholesale price inflation surged to 9.68% in May 2026 from 8.26% in April, driven by a near-30% spike in fuel and power, even as the government unveiled a revamped 2022-23 base-year series.
India unveils new industrial production index with 2022-23 base year; April output up 4.9%
The statistics ministry's revamped Index of Industrial Production widens coverage to include gas, water and waste-management activities, with manufacturing leading the first reading under the new series.

Goa Backs 15 Startups With Seed Funding to Widen Tech Base
Goa's IT department has approved seed funding for 15 startups, a push to diversify the tourism-heavy state economy by helping early-stage founders move from prototype to product and hiring.
Defence Ministry Plans Seven Manufacturing Clusters to Boost Military Production
India's Ministry of Defence is reported to be planning seven manufacturing clusters to deepen supply chains, cut import dependence and draw private industry into higher-value military production.